SFRplus Chart on Photographic Paper QI-SFR10-P-RM
SFRPlus Test Charts
PRODUCT DETAILS
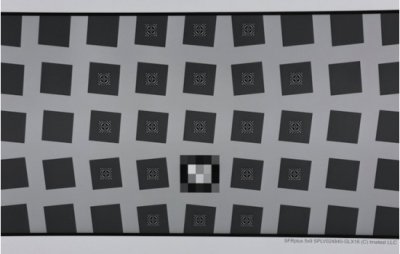
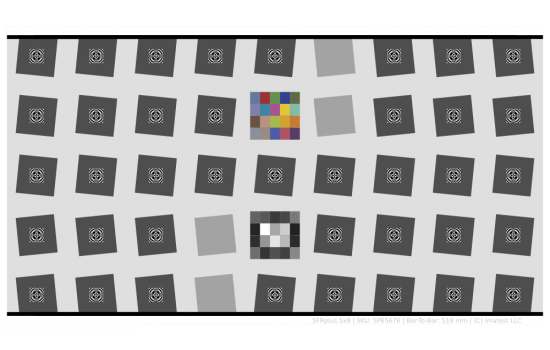
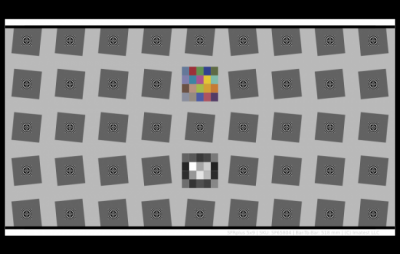
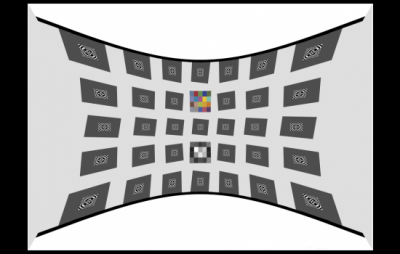
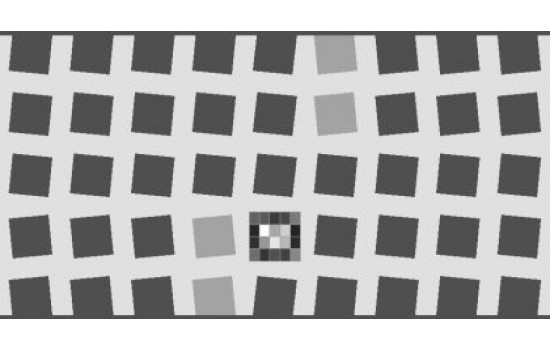
The SFRplus test chart can be used with the SFRplus module in Imatest 3.2 or later to measure MTF, lateral chromatic aberration, distortion, and tonal response. The SFRplus module features fully automated region-of-interest detection.
The SFRplus chart offers significant advantages over commonly used charts such as the ISO 12233 chart, including
- much less wasted area,
- The ability to produce a map of sharpness over the sensor surface,
- better measurement accuracy due to the lower contrast,
- full support for automated testing.
SFRplus charts on photographic paper have the following properties:
- 5x9 grid pattern
- Active Area: 223mm x 356mm. It is recommended these charts be used to test imaging systems with sensors up to 3 MP. For larger image sensor sizes, please see other SFRplus chart listings. The active area of the chart includes white space above and below the top and bottom distortion bars. It is typically about 10% larger than the printed area, which is bounded by the distortion bars on top and bottom. White space is included because test images of the chart must include this white space in order to enable automated processing in SFRplus software.
- Contrast levels: 10:1 and 2:1 contrast levels to analyze non-linear signal processing
PRE : Standard SFRplus Chart
NEXT : Automotive Test Chart
RECOMMENDED PRODUCT